Debugging Blueprints
Debug RUAL blueprint flows with simulation mode, the console, production runs, and the audit log. Read error pins and test blocks systematically.
This page covers the tools and techniques for finding out why a flow misbehaves. If you are looking for a fix to a specific symptom, start with Common Issues & Fixes. For execution semantics: dataflow, parallel branches, and error handling. See Block Execution.
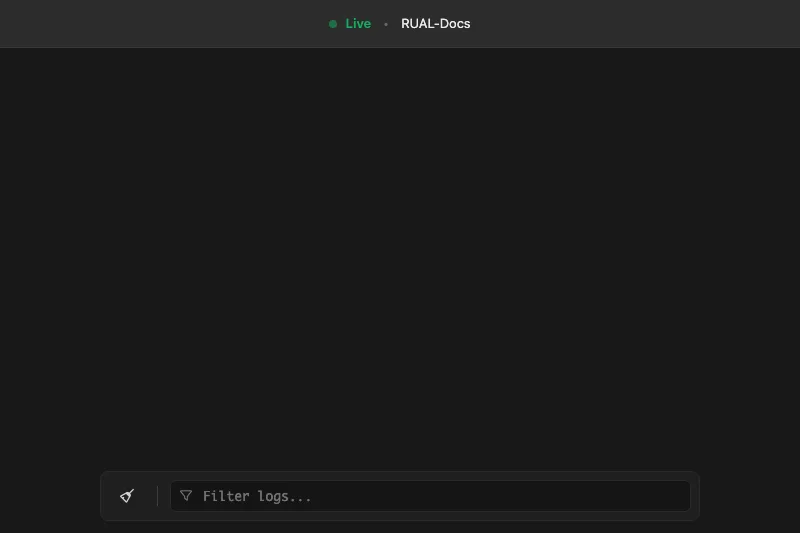
Using the console
The blueprint console shows execution details for your flows and is often the fastest way to see what a flow actually did. Activate it through the Options menu in the top right of your blueprint, then run the flow: for example through simulation mode: and watch the console output to pinpoint where behavior diverges from what you expect.
Simulating blocks and functions
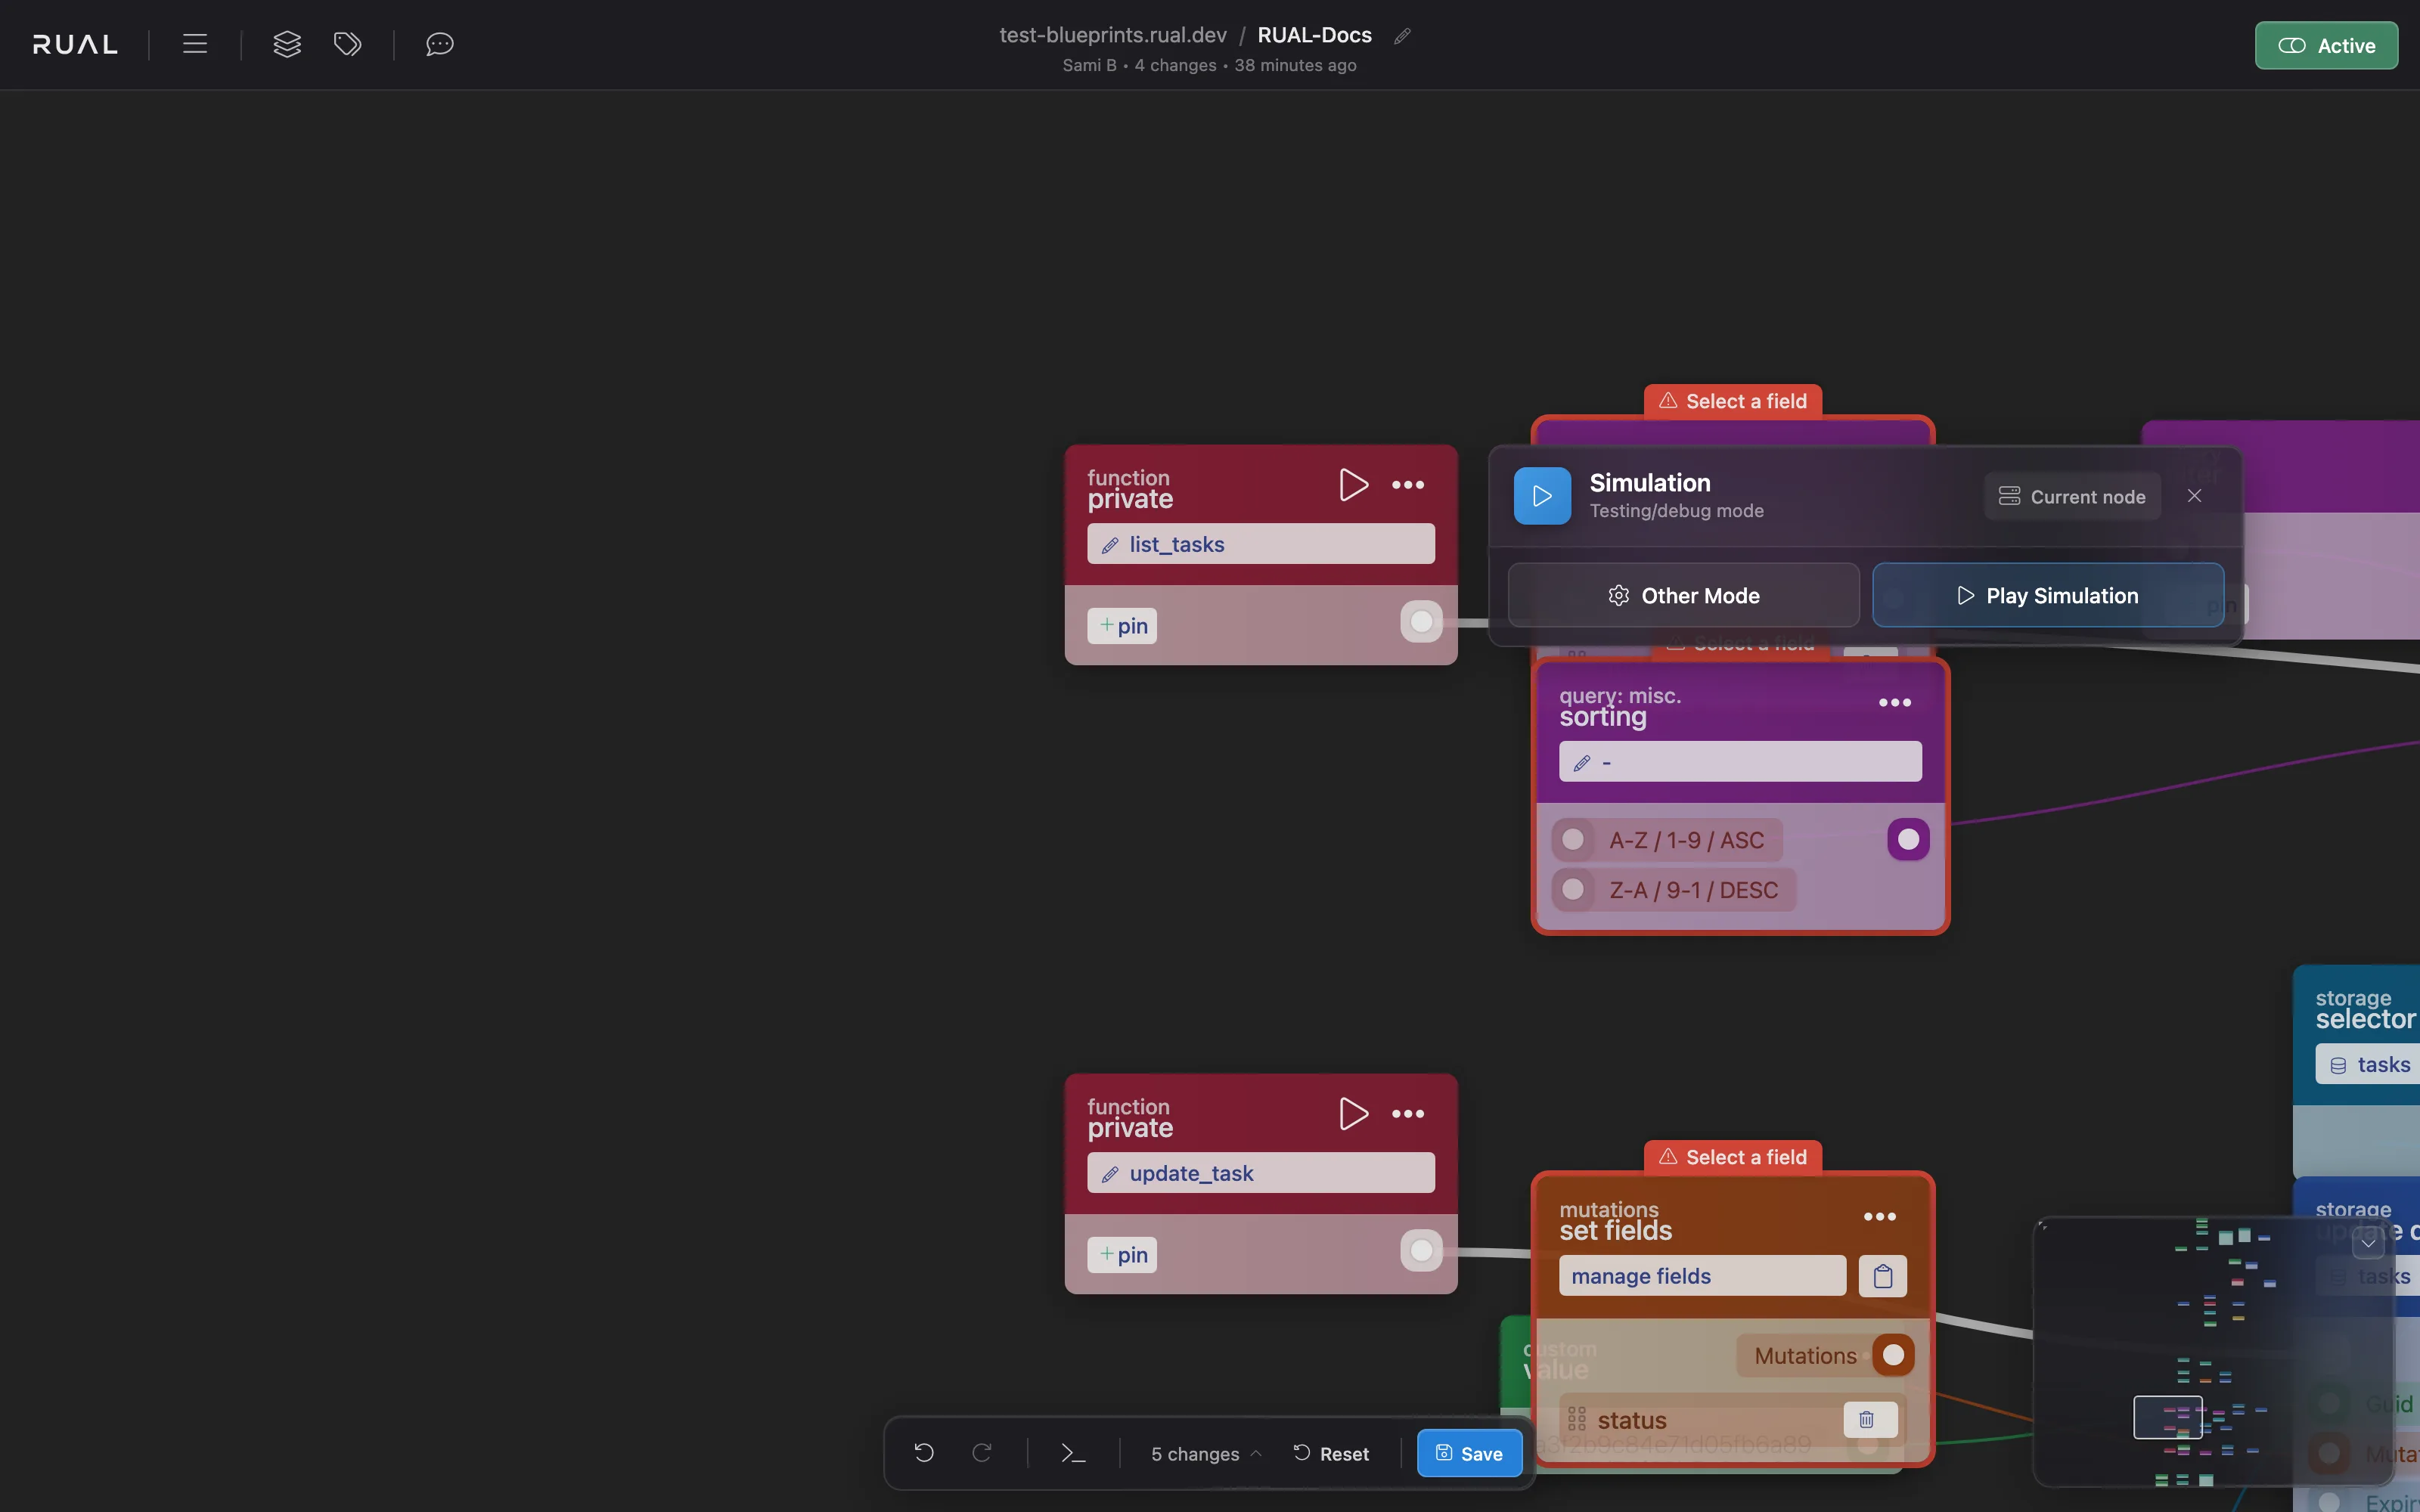
Blocks at the beginning of a flow feature a play icon. Clicking it opens a popup where you can switch between play modes, activate the current mode (default is simulation), and adjust simulation values. Each out-pin of the starting block can be given a test value, which is then passed to the connected blocks as the simulation traces through the flow. This makes simulation mode ideal for end-stage debugging: you see the output at every step without touching real traffic.
Simulation values must be formatted according to their pin type, or the simulation will not produce the results you expect:
| Pin Type | Formatting |
|---|---|
value |
"value" or "" |
number |
1 |
condition |
true or false |
object |
{"key": "value"} or {} |
array |
["value1", "value2"] or [] |
date |
1749321690 (timestamp as number) |
uiclass |
"uiclass" or "" |
uistyle |
{"background": "grey"} or {} |
uiattributes |
{"loading": "lazy"} or {} |
Production run vs development view
Simulation runs against development data. When a bug only appears with real data, select Production Run in the play mode options: it executes the non-deployed (development) blueprint against production data. This lets you debug the current state of your blueprint with real documents, without deploying anything and without affecting the live production environment.
Keep the difference in mind when interpreting results: the development view shows your unsaved/saved working state, while production users run the last deploy. If development works but production does not, the blueprint was probably never deployed. See Blueprint not saving / changes lost.
Production Run permission can be disabled for specific users in User Access Management. If the option is missing from your play mode menu, ask an administrator to enable it for your account. Audit log navigation
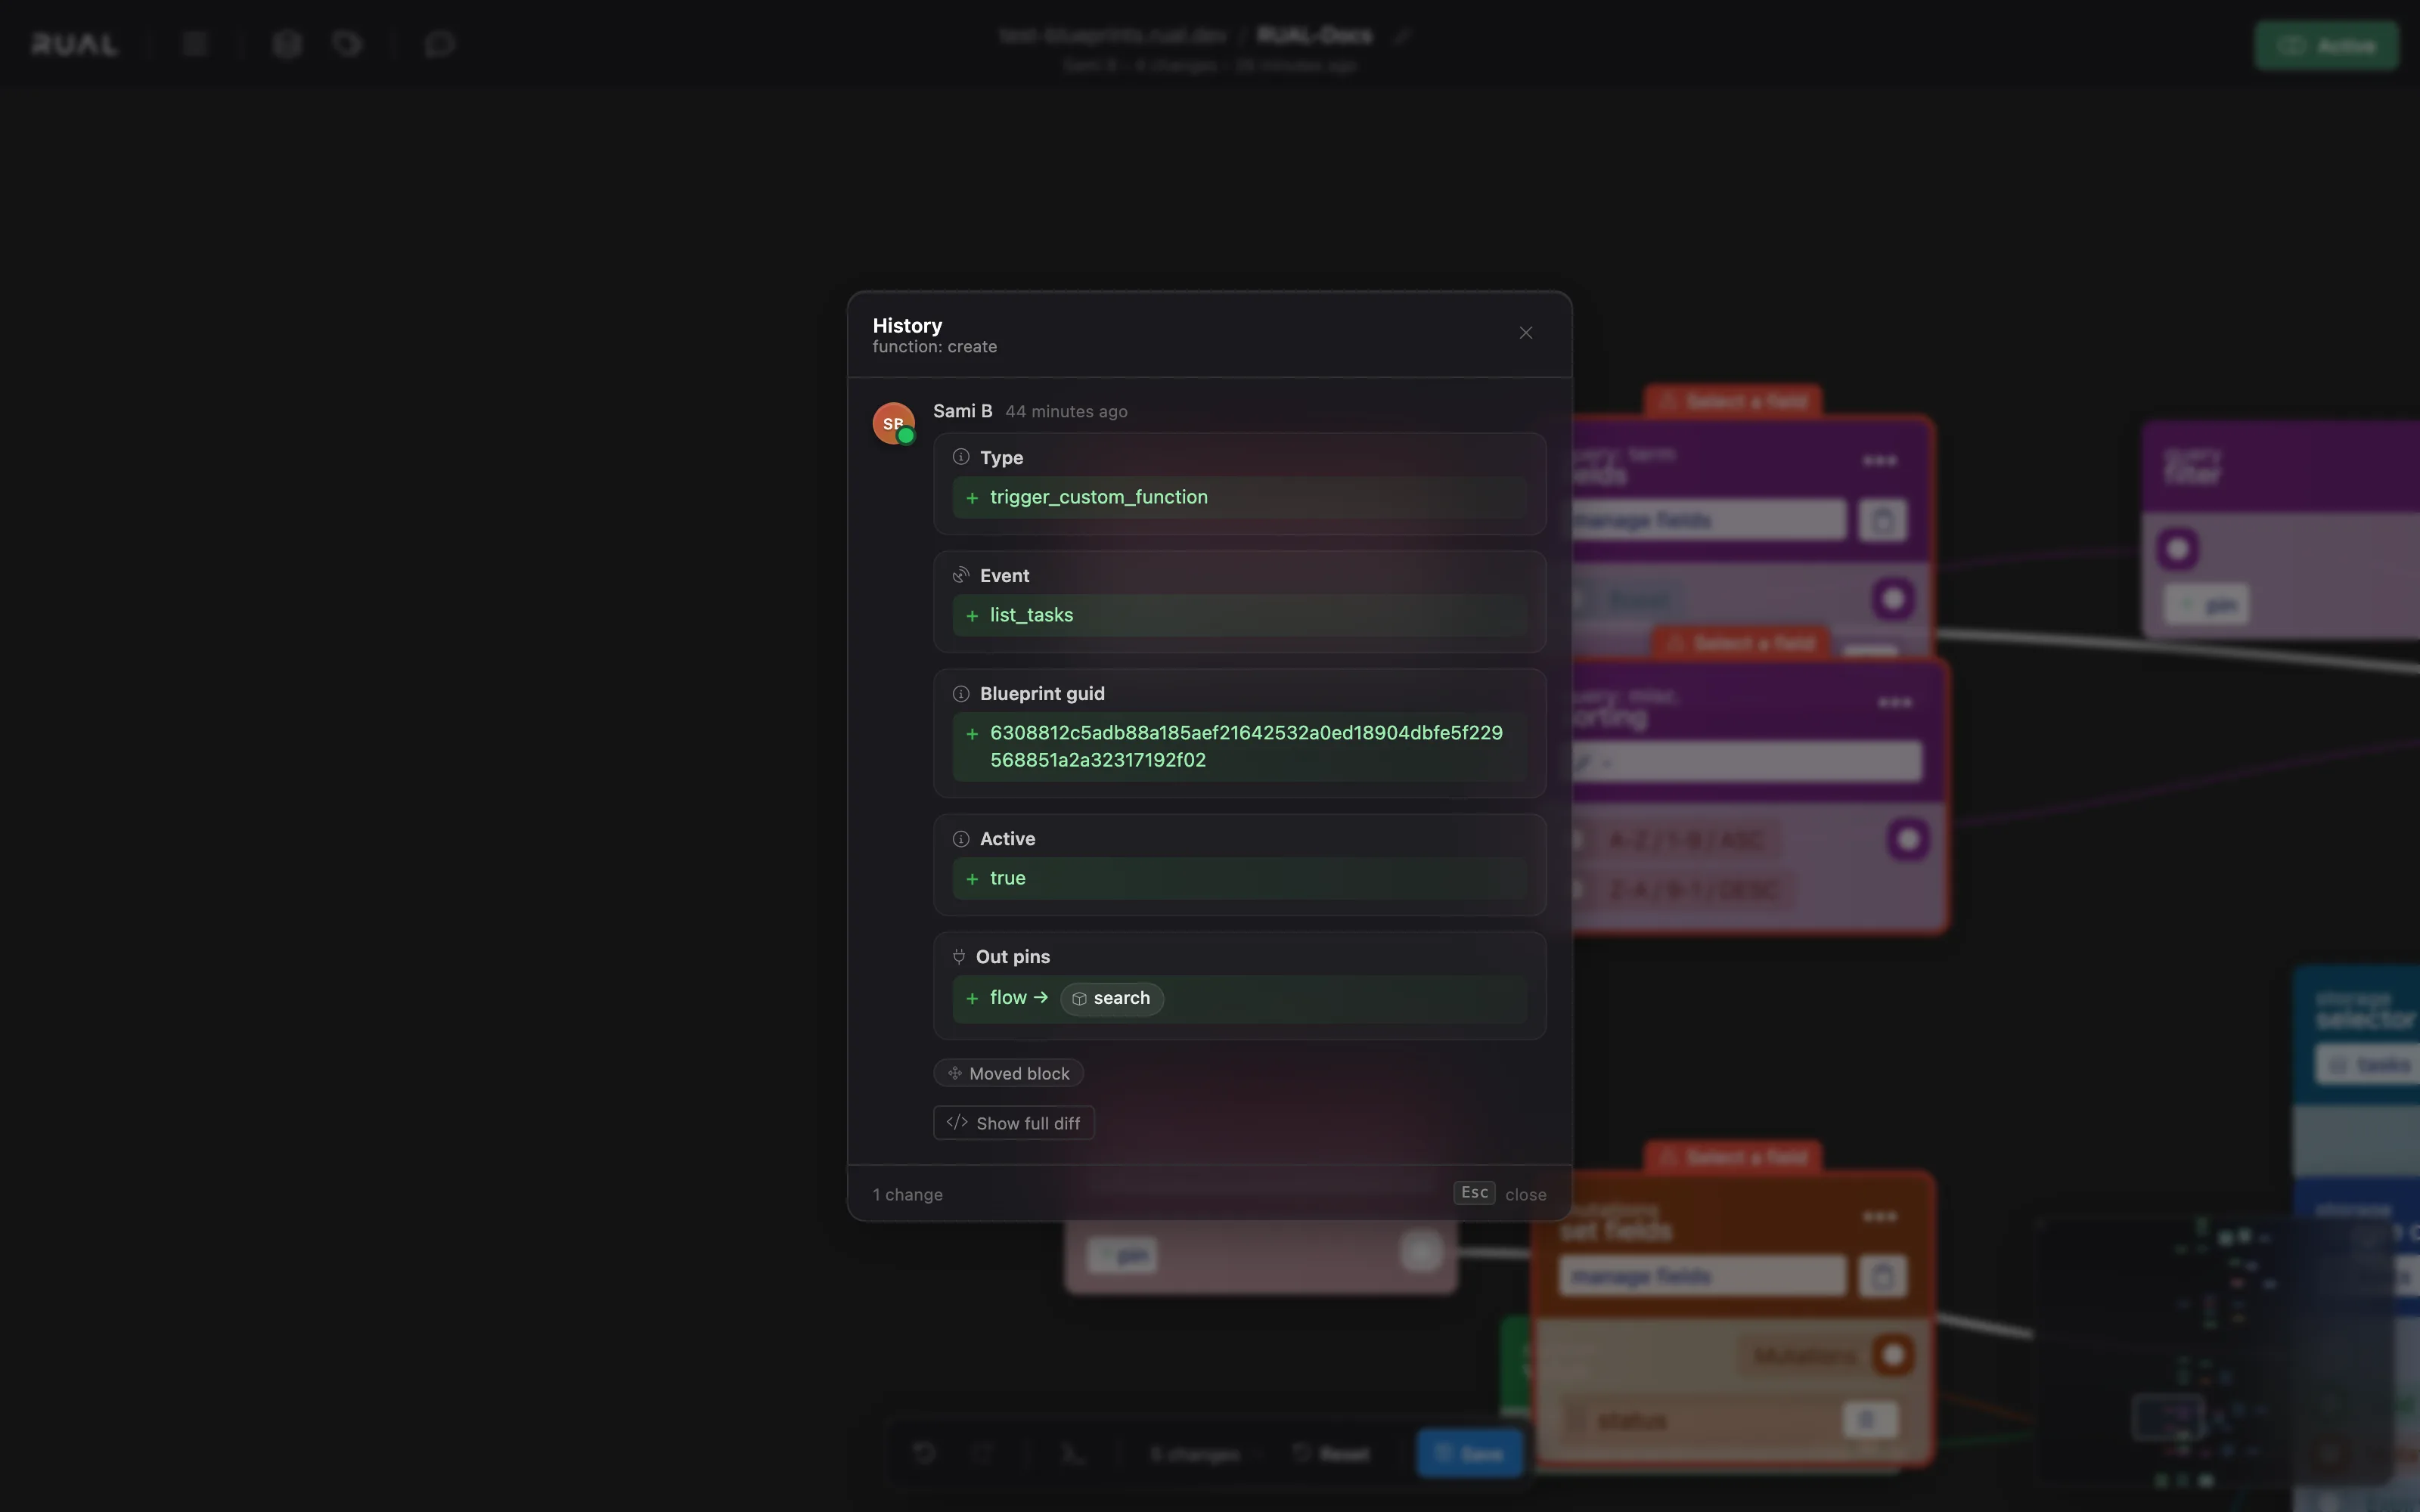
Every blueprint modification is automatically logged: like git commits, but with real-time collaboration. The audit log records who changed what and when, which makes it the first place to check when a flow that used to work suddenly behaves differently.
- Whole blueprint: open the audit log through the
Optionsmenu in the top right of the blueprint. - Single block: click the block's options (
) and selectRevisionsto see only the changes affecting that block.
Reading error messages
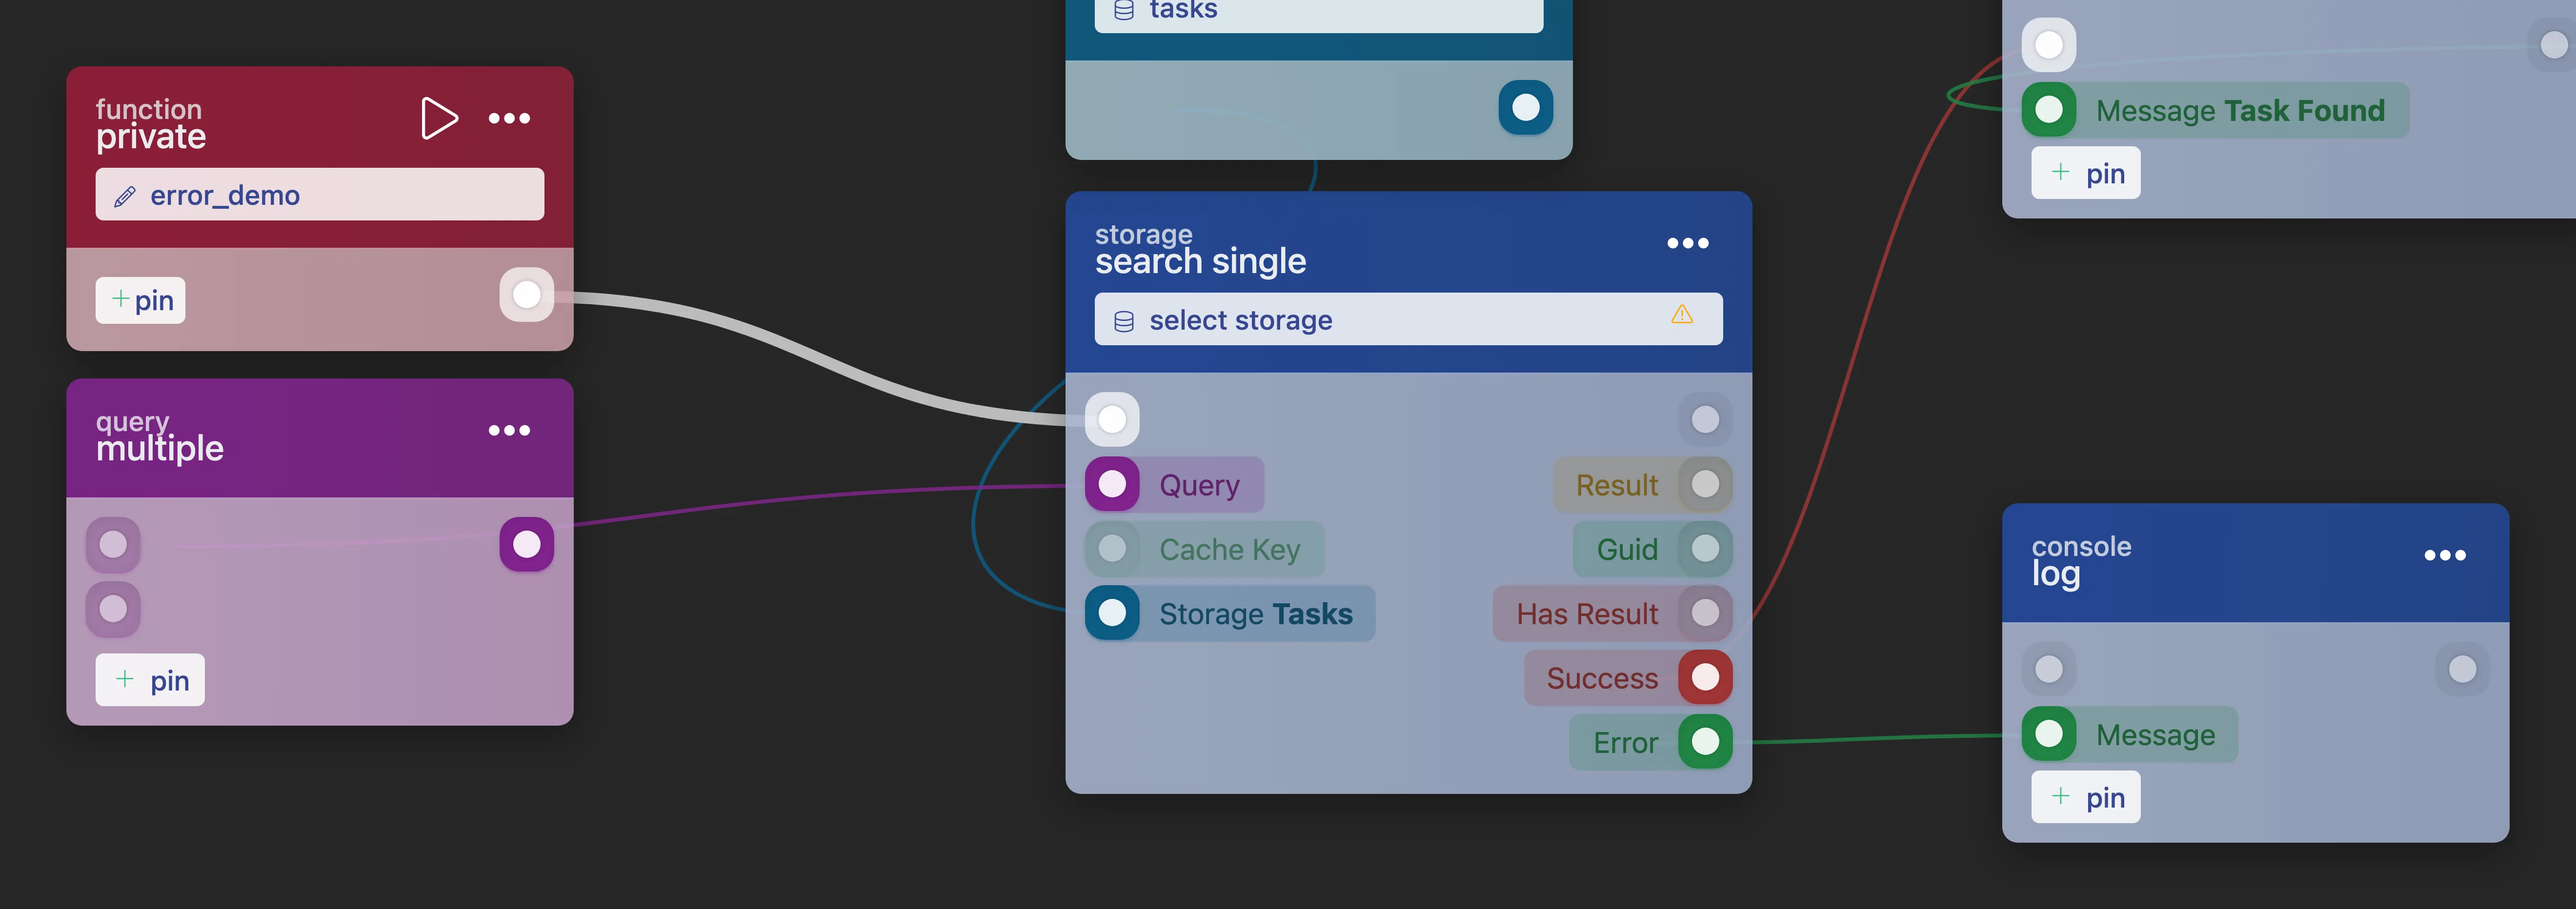
RUAL has no try/catch mechanism. When a block fails, the flow does not stop: instead, blocks that can fail expose their result through output pins:
success. A condition pin that istruewhen the operation succeeded andfalsewhen it failed.error. A value pin containing the error message when the operation fails.
A typical error payload looks like this:
{
  "success": false,
  "error": "Document not found for the given GUID"
}
Always connect and inspect these pins on blocks that perform storage operations, HTTP requests, or anything else that can fail. An unconnected error pin means failures pass silently. See Error Handling for the common handling patterns.
The table below maps frequent error symptoms to their likely cause and the first thing to check:
| Symptom | Likely cause | First thing to check |
|---|---|---|
Document not found for the given GUID |
The GUID fed into the block is empty, wrong, removed, or expired. | Simulate the flow and inspect which value actually reaches the GUID in-pin. |
| Flow stops doing anything after a block | The block failed and its success/error pins are unconnected, so the failure is silent. |
Connect the success pin to a condition block and log or display the error pin. |
| Search returns an empty array | Indexing delay, or case-sensitive mismatch between stored and searched values. | Check the casing of the stored value, and retry with the disable cache query option. See real-time search. |
| Function does not execute from another blueprint | The function is private, or the blueprint containing it is not activated. | Check the function's visibility and press Activate on the owning blueprint. |
| API returns 401 | Missing/expired token, or the caller lacks the endpoint's scope. | See Connection problems and Remote Access Control. |
| Works in development, not for users | Changes saved but never deployed to production. | See Blueprint not saving / changes lost. |
Testing blueprints systematically
When a flow is too tangled to debug by inspection, work through it in order:
- Isolate: narrow the problem down to the smallest flow (or function) that still shows the wrong behavior. Use the block
Revisionsto confirm nothing changed unexpectedly. - Simulate. Run that flow in simulation mode with controlled values in the correct pin-type format, and trace the output at each step.
- Verify pins. Check that every block along the path receives the in-pin values you expect and produces the out-pin values the next block needs. Pay special attention to
success/errorpins on storage and HTTP blocks. - Confirm against production data. If simulation passes but the live flow still fails, repeat the run with
Production Runto rule out data-dependent issues.
Frequently asked
How do I debug a RUAL blueprint?
Use the console to see the executed path and the values that flowed through it, simulate individual blocks and functions, compare the production run against the development view, and read the error pins on blocks that can fail.
Why does my flow fail silently in RUAL?
An unconnected error pin means failures pass without a trace. Wire the error pin of every block that can fail to something that logs or reports it.